반응형
원문: https://www.zabbix.com/wiki/howto/monitor/db/orabbix_monitor_oracle_with_zabbix
아래는 오라클 DB 에서 모니터링 가능한 내용의 예이다.
- DB Version (i.e. Validity of package)
- Archiving (Archive log production with trend analysis)
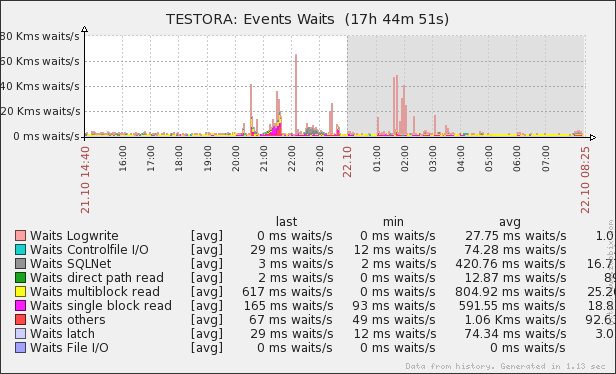
- Event Waits (Files I/O, single block read, multi-block read, direct path read, SQLNet Messages, Control file I/O, Log Write)
- Hit Ratio (Hit Ratio on Triggers, Tables/Procedures, SQL Area, Body)
- Logical I/O (Server performance on Logical I/O of: Current Read, Consistent Read, Block Change)
- Physical I/O (Redo Writes, Datafile Writes, Datafile Reads)
- PGA
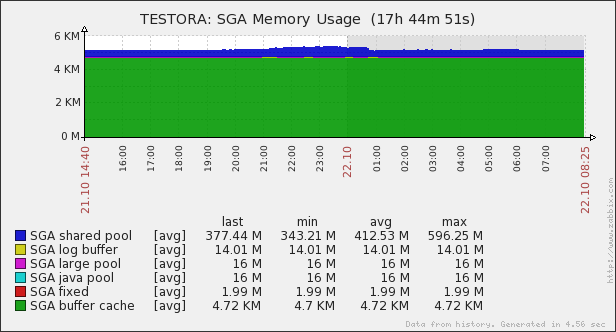
- SGA (In particular; Fixed Buffer, Java Pool, Large Pool, Log Buffer, Shared Poolm Buffer Cache)
- Shared Pool (Pool Dictionary Cache, Pool Free Memory, Library Chache, SQL Area, MISC.)
- Pin Hit Ratio (Oracle library cache pin are caused by contention with the library cache, the area used to store SQL executables for re-use)
- Sessions / Processes
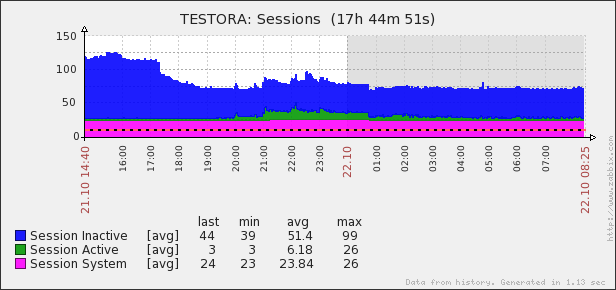
- Sessions (Active Sessions, Inactive Sessions, System Sessions)
- DBSize/DBFileSize (DBSize size of database really used space and of Filesize)
그래프로 생성 가능한 항목들이다.
- Archivelog
- DBSize and DBFileSize
- Events Wait
- HIT Ratio
- Logical I/O
- PGA
- Pin HIT Ratio
- Session
- SGA
- Shared Pool
- Sessions Processes
Events Wait 모니터링 화면
SGA Memory 모니터링 화면
Session 써머리
'기술' 카테고리의 다른 글
| 간만의 WebLogic 공부 - WebLogic을 웹서버처럼 사용하기 (0) | 2014.11.27 |
|---|---|
| Zabbix에서 WebLogic JMX 모니터링 기능 안됨 (0) | 2014.11.26 |
| Python에 대한 단상 (0) | 2014.11.13 |
| Cloudant DB에 Java Ektorp 라이브러리를 통해 쿼리 사용하기 (0) | 2014.03.27 |
| Cloudant DB에 Java Ektorp 라이브러리를 통해 접근하기 (0) | 2014.03.27 |


