WebLogic에서는 JMX 연결을 하려면 RMI/IIOP를 사용한다. (아래 블로그 참고)
http://blog.naver.com/javalove93/130031031944
그런데 Zabbix에서는 JMX 연결 시(Java Agent를 통해) 프로토콜을 지정할 수 없어 WebLogic JMX에 직접 접속할 수 없다.
Zabbix에 Zapcat이라는 다른 방식이 있는 것 같은데 이것은 Application 내에 JAR를 포함시켜야 하는 것으로 보여 역시 일반적으로 사용하기에는
쉽지 않아 보인다 (http://www.kjkoster.org/zapcat/How_To.html)
https://support.zabbix.com/browse/ZBXNEXT-1935
Java gateway server only support RMI protocol, but WebLogic doesn't support RMI. It's necessary to use IIOP protocol.
http://docs.oracle.com/cd/E13222_01/wls/docs90/jmx/accessWLS.html
Also, there is a difference in environment parameter of JMXConnectorFactory.connect method for WebLogic JMX
Current java gateway code:
env = new HashMap<String, String[]>();
env.put(JMXConnector.CREDENTIALS, new String[]
);
Sample code from WebLogic documentation:
Hashtable h = new Hashtable();
h.put(Context.SECURITY_PRINCIPAL, username);
h.put(Context.SECURITY_CREDENTIALS, password);
h.put(JMXConnectorFactory.PROTOCOL_PROVIDER_PACKAGES, "weblogic.management.remote");
결론적으로는 애매해 보이는데 Zabbix의 Java Gateway를 조금 수정해서 IIOP를 지원하게 하거나
WLS JMX 를 일반적인 RMI기반 JMX로 Wrapping할 수 있는 프로그램을 만들면 어떨까 하는 생각이다.
'기술' 카테고리의 다른 글
| TCP CLOSE_WAIT + FIN_WAIT를 테스트해 볼 수 있는 예제 (0) | 2014.12.01 |
|---|---|
| 간만의 WebLogic 공부 - WebLogic을 웹서버처럼 사용하기 (0) | 2014.11.27 |
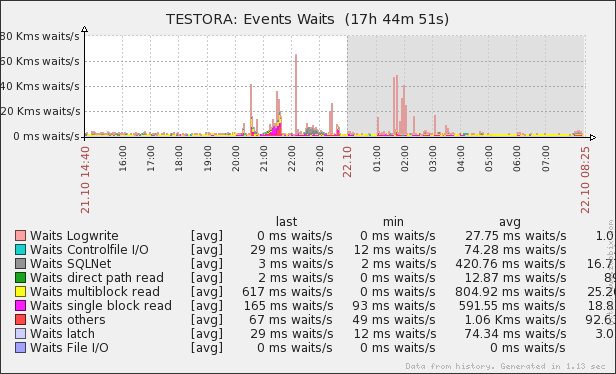
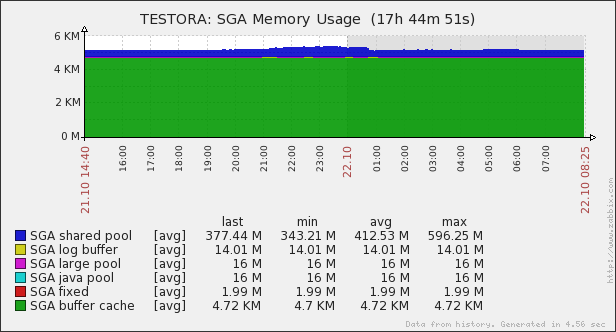
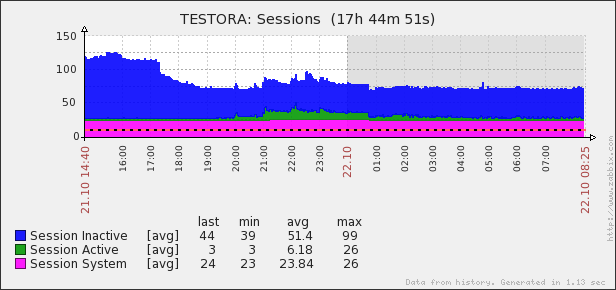
| Orabbix: Monitor Oracle With Zabbix의 기능 (0) | 2014.11.26 |
| Python에 대한 단상 (0) | 2014.11.13 |
| Cloudant DB에 Java Ektorp 라이브러리를 통해 쿼리 사용하기 (0) | 2014.03.27 |